Subject:  How Should We *Motivate* Students in Intro Stat?

   Date:  Sunday December 1, 1996

   From:  Don Macnaughton <donmac@matstat.com>
                 (formerly donmac@hookup.net)

     To:  EdStat-L mail list and sci.stat.edu newsgroup
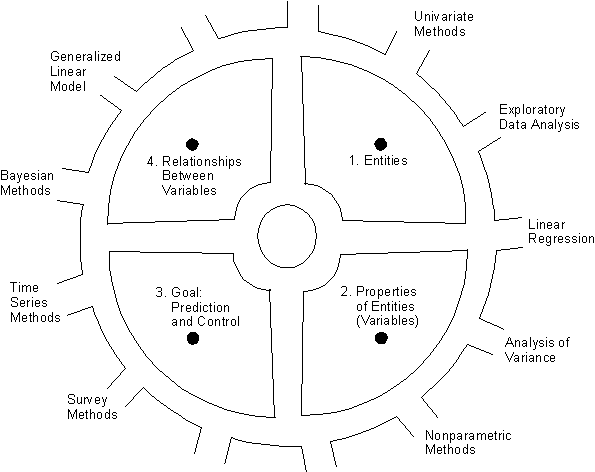
Students frequently view statistics as the worst course taken in
college (Hogg 1991, Iman 1994).  One way of addressing this prob-
lem is to improve the way we *motivate* students to study statis-
tics.


CURRENT MOTIVATION APPROACHES
One popular approach to motivating students is to tell them they
are going to learn how to "analyze data".  But students can an-
swer, in their embarrassingly frank way, "borrr-ring".  They can
answer this way because they see no obvious payoff from "analyz-
ing data".

Another approach is to tell students they are going to learn how
to "make inferences from data".  But what does that mean?  Most
of us can answer that question for students, but it takes at
least a term.  And by the end of the term a significant propor-
tion of the students may be lost.

Yet another approach is to tell students they are going to learn
how to "make decisions".  But that is only indirectly true be-
cause students will not be much better at making decisions after
one or even several statistics courses.  In fact, even we statis-
ticians rarely make direct use of statistical procedures when we
make decisions in our own lives.  (How often in your private life
have you directly interpreted an analysis of variance in order to
make a decision?)

(Of course, *indirectly* many decisions in people's private lives
are based on statistical analysis of the results of empirical
[i.e., scientific] research--especially findings of relationships
between variables, as I discuss below.  However, the indirect as-
pect of the decision element makes it difficult to impart to stu-
dents.)

Still another approach to motivating students is to tell them
they are going to learn how *scientists* make decisions.  This is
closer to being correct--scientists clearly do make many impor-
tant "decisions" on the basis of statistical analysis of data.
However, the so-called "decisions" almost always lack certainty,
and are thus better characterized as "accepted theories" rather
than as hard and fast "decisions".  Thus the concept of making
decisions is (although present) not an essential element of what
scientists do with statistics.

An escapist approach to motivating students is simply not to try
to do any motivation.  Instead, the teacher immediately launches
into discussing statistical topics, hoping the students will
somehow infer the motivating usefulness of our field on their
own.  Unfortunately, under this approach (as under all the other
approaches above) most students *fail* to find the motivating
usefulness of statistics, and are thus dreadfully bored.


RECOMMENDATION
Let me now recommend an approach to motivating students to study
statistics.  The approach is based on the concept of *predic-
tion*.

Under the approach, the first thing we tell students about sta-
tistics is that they are going to learn how to *make accurate
predictions*.  For example, students will learn how to accurately
predict
- the mark they will get on the final
- their average annual income over the next several years
- their longevity
- whether it will rain tomorrow
- just about anything else of interest (if it can be reliably
  measured).

We should tell students they will learn how to make accurate pre-
dictions using scientific methods that are recognized throughout
science and empirical research as being the *very best methods
available*.

(Of course, along with prediction methods, students will also
learn the more complicated methods of exercising accurate con-
trol.  However, for simplicity, I recommend this topic be down-
played at the beginning.)

After starting the course with the promise that students will
learn how to make accurate predictions, we can then develop the
field of statistics for students as a set of methods for making
accurate predictions.  If we do this well, we are guaranteed that
students will be highly motivated because most people (including
most students) are keenly interested in knowing how to make accu-
rate predictions.

Fortunately, there is no doubt that we *can* do this well because
we statisticians hold the keys to a set of optimal prediction
(and control) methods that are one of the great treasures of mod-
ern science.

Let me explain the steps I am proposing in more detail.


STEP 1:  START WITH THE CONCEPT OF A "VARIABLE"
I believe the first step in building the field of statistics for
students is to give them a clear sense of the concept of a *var-
iable*.  This step is necessary because the entire field of sta-
tistics is built around this concept.

(Interestingly, the concept of "variable" is so ubiquitous and
fundamental in statistics that some introductory courses and
textbooks take the concept almost completely for granted, with
almost no formal discussion of it.  By assuming students have a
satisfactory understanding of the concept of "variable", these
approaches befuddle a significant proportion of students right
from the start.)

A reasonable definition of the concept of "variable" is
  A *variable* is a formal representation of a property of enti-
  ties.

This definition helps students to understand the concept of "var-
iable" in terms of other concepts that are simple, intuitive, and
fundamental.  I discuss the definition further in a paper for
students (1996a) and in a Usenet post (1996b).

(Of course, when the above definition is used in an introductory
course, it must be expanded with examples and discussion, includ-
ing careful discussion of the concept of a *value* of a vari-
able.)


STEP 2:  SHOW THAT ALL PREDICTIONS CAN BE VIEWED AS PREDICTING
THE VALUES OF VARIABLES
Once students have a good sense of the concept of a variable, we
can then show them how virtually all prediction problems can be
usefully viewed as problems of *predicting the values of vari-
ables*.  We can illustrate this fact by discussing various impor-
tant prediction problems that have been studied in scientific
(i.e., empirical) research, noting in each case that what is be-
ing predicted can be viewed as being the value of a variable.


STEP 3:  SHOW THAT RESEARCHERS PREDICT THE VALUES OF VARIABLES BY
STUDYING RELATIONSHIPS BETWEEN VARIABLES
After we have convinced students that it is the values of vari-
ables that are predicted in prediction problems, we can then ad-
dress the question of *how* we can predict the values of vari-
ables.  Here we can use a set of examples to demonstrate that re-
searchers discover how to predict the values of variables by
studying *relationships between* variables.

Interestingly, it is easy to find such examples because (as I
discuss in a paper for teachers, 1996c) most (all?) empirical re-
search projects can be usefully viewed as studying variables or
relationships between variables as a means to predicting or con-
trolling the values of variables.

(The preceding sentence makes a strong claim.  I invite readers
to propose counterexamples.)


STEP 4:  SHOW THAT THE FIELD OF STATISTICS PROVIDES OPTIMAL
TECHNIQUES FOR STUDYING RELATIONSHIPS BETWEEN VARIABLES
Once we have convinced students of the usefulness of relation-
ships between variables as a means to prediction, we can then
bring the field of statistics out on the stage.   We can intro-
duce the field to students as a set of optimal techniques to help
empirical researchers study variables and relationships between
variables as a means to accurately predicting and controlling the
values of variables.


I discuss and illustrate the above four steps in more detail in
the two papers (1996a, 1996c).


A BEAUTIFUL PARK
Metaphorically, we can view the concepts discussed above as four
monuments in a beautiful small park lying at the center of a
great city, as shown in figure 1.
Figure 1.  A map of four monuments in a park at the center of a
city.  The monuments represent four fundamental concepts of sta-
tistics and empirical research.

The four monuments represent the concepts of
1. entities
2. properties of entities (which are roughly equivalent to vari-
   ables)
3. a fundamental goal of empirical research:  to predict and con-
   trol the values of variables
4. relationships between variables as a means to accurately pre-
   dicting and controlling the values of variables.
I recommend that teachers lead students to each monument in the
park in turn and provide examples and discussion to demonstrate
the simplicity, beauty, and power of these fundamental concepts.

The third monument (prediction and control) is the most important
because it represents a key goal of both empirical research and
statistics.

(At the center of the park is the fountain of empirical truth.)

After they are well acquainted with the monuments in the park, we
can then guide students partway down some of the paths that lead
out of the park into sections of the surrounding city.  Each sec-
tion represents a different branch of the field of statistics.

The sections have an important common focus:  Each section is
simply a different set of techniques for studying variables or
relationships between variables as a means to accurately predict-
ing or controlling the values of variables.


SUMMARY
Most students are highly interested in knowing how to make accu-
rate predictions.  Therefore, if we teach the field of statistics
as a set of methods to help make accurate predictions, we are
guaranteed that students will obtain a lasting appreciation of
our field.

--------------------------------------------------------
Donald B. Macnaughton   MatStat Research Consulting Inc.
donmac@matstat.com      Toronto, Canada
--------------------------------------------------------


REFERENCES
Hogg, R. V. (1991), "Statistical Education:  Improvements Are
   Badly Needed," _The American Statistician,_ 45, 342-343.

Iman, R. L. (1994), "The Importance of Undergraduate Statistics,"
   _Amstat News,_ Number 215, December 1994, 6.

Macnaughton, D. B. (1996a), "The Entity-Property-Relationship Ap-
   proach to Statistics:  An Introduction for Students."  Avail-
   able at http://www.matstat.com/teach/

Macnaughton, D. B. (1996b), "Response to comments by Robert
   Frick."  Posted to the sci.stat.edu Usenet newsgroup on July
   28, 1996 under the title "Re: EPR Approach to Intro Stat:  Re-
   lationships between variables".  Available at
   http://www.matstat.com/teach/p0015.htm

Macnaughton, D. B. (1996c), "The Introductory Statistics Course:
   A  New Approach."  Available at http://www.matstat.com/teach/
Home Page for the Entity-Property-Relationship Approach to Introductory Statistics